U.S. Energy-related CO2 Emissions 2015: 12% Below 2005 Levels

May 17, 2016

U.S. energy-related carbon dioxide emissions in 2015 are 12% below their 2005 levels

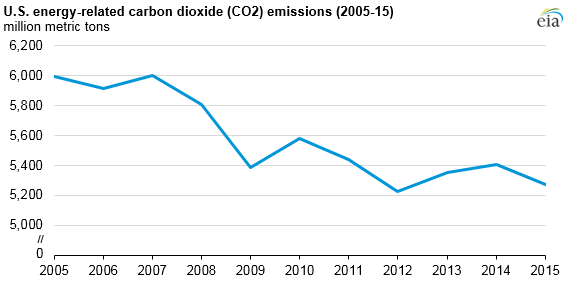
After increasing in 2013 and in 2014, energy-related carbon dioxide (CO2) emissions fell in 2015. In 2015, U.S. energy-related carbon dioxide emissions were 12% below the 2005 levels, mostly because of changes in the electric power sector.

Energy-related CO2 emissions can be reduced by consuming less petroleum, coal, and natural gas, or by switching from more carbon-intensive fuels to less carbon-intensive fuels. Many of the changes in energy-related CO2 emissions in recent history have occurred in the electric power sector because of the decreased use of coal and the increased use of natural gas for electricity generation.

The reductions in CO2 emissions are spread out among the different end-use sectors in proportion to the share of total electricity sales to each sector. Overall, the fuel-use changes in the power sector have accounted for 68% of the total energy-related CO2 reductions from 2005 to 2015.

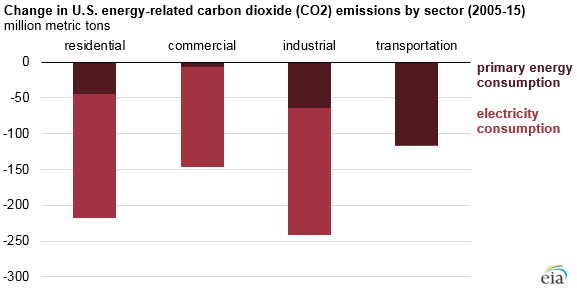
The amount of CO2 emissions in the primary (non-electricity) energy mix of end-use sectors has also changed. In the residential and commercial sectors, primary energy such as natural gas is used mainly for space heating, water heating, and cooking. In the industrial sector, many processes rely on the direct consumption of fossil fuels to produce heat. Most of the energy consumed in the transportation sector is primary energy in the form of motor gasoline, diesel fuel, and jet fuel.

Two of the largest factors in year-to-year fluctuations of energy-related CO2 emissions are the economy and the weather. The largest annual decline in energy-related CO2 emissions in the past decade occurred in 2008–09 during the recession. Overall, the U.S. economy has grown even as energy-related CO2 emissions have fallen.

Adjusted for inflation, the economy in 2015 was 15% larger than it was in 2005, but the U.S. energy intensities and carbon intensities have both declined. On a per-dollar of gross domestic product (GDP) basis, in 2015, the United States used 15% less energy per unit of GDP and produced 23% fewer energy-related CO2 emissions per unit of GDP, compared with the energy and emissions per dollar of GDP in 2005.


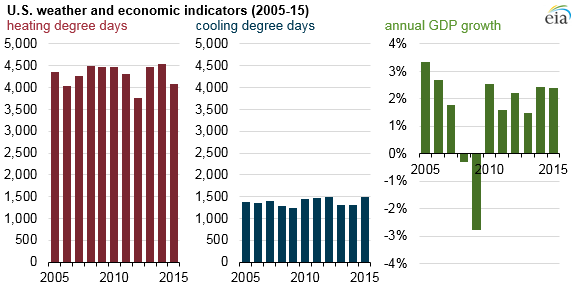
Weather also plays a role in annual fluctuations of energy-related CO2 emissions. Heating and cooling degree days measure daily temperature differences compared with a base temperature of 65 degrees Fahrenheit (about 18 degrees Celsius). For instance, a daily average temperature of 45 degrees means 20 heating degree days; a daily average of 85 degrees means 20 cooling degree days.

On a population-weighted national basis, the United States has about three times as many heating degree days as cooling degree days. For this reason, annual energy-related CO2 fluctuations are more likely to resemble annual fluctuations in heating degree days. In the past decade, energy-related CO2 emissions and heating degree days were both lowest in 2012.


By Russell Lacey June 24, 2026
For most business owners, the monthly utility bill is just another line item to be paid and filed away. You glance at the total, ensure it isn't astronomically higher than last month, and move on. But in 2026, with energy markets facing unprecedented volatility and complex new tariff structures, that "glance and pay" strategy is costing American businesses billions in overpayments. The good news? You don’t have to just accept these costs as the price of doing business. Everyone is talking about utility bill audits because they have transitioned from a "nice-to-have" occasional check to a critical financial strategy. At Electric Advisors, Inc., we’ve seen firsthand how a meticulous review of historical invoices can uncover significant refunds and permanent rate reductions. 
By Russell Lacey June 15, 2026
In the world of commercial operations, finding a way to slash overhead by double digits without spending a dime upfront is usually a red flag for a "too good to be true" offer. But in 2026, for businesses operating within the BGE, Pepco, Potomac Edison, and Delmarva utility territories across Maryland and Delaware, this isn't a sales pitch, it’s a regulatory reality. Community solar has evolved from a niche pilot program into a mainstream financial strategy for savvy business owners. If your business pays its own utility bills but doesn't have the roof space, the capital, or the long-term lease to install traditional solar panels, community solar is your bridge to immediate savings. The good news? You can typically reduce your monthly electricity spend by 8% to 12% simply by enrolling. Here is how your business can capture this "easy win." Key Takeaways Zero Upfront Costs: No installation, no equipment maintenance, and no capital expenditure. Guaranteed Savings: Most subscriptions offer a fixed percentage discount (typically 8–12%) on the solar credits applied to your bill. Tenant-Friendly: Perfect for businesses that rent their office, warehouse, or retail space. Market Reach: Available to businesses in BGE, Pepco, Potomac Edison, and Delmarva (MD & DE) territories. Risk Mitigation: Electric Advisors handles the vetting to ensure you choose a project with favorable terms and no hidden cancellation fees.
By Russell Lacey April 17, 2026
For most business owners in Washington, D.C. and Maryland, June 1st marks the unofficial start of summer: the return of rooftop happy hours, tourists swarming the National Mall, and the inevitable cranking of the HVAC system. But in the world of energy management, June 1st is something much more significant. It is the "Energy New Year." If you manage a commercial property, a non-profit, or a restaurant, this date represents the reset button for how your utility costs are calculated for the next twelve months. While many decision-makers focus solely on the "supply rate" on their bill, there is a hidden mechanism called the Peak Load Contribution (PLC) that could be quietly inflating your costs by thousands of dollars The good news? You aren’t powerless. By understanding how the grid works and taking a few strategic steps this spring, you can "beat the surge" and secure better financial predictability for your organization. The June 1st Milestone: Why It’s the "Energy New Year" In the Mid-Atlantic region: specifically within the territories served by utilities like Pepco and BGE: we operate under the PJM Interconnection . PJM is the regional transmission organization that coordinates the movement of wholesale electricity across 13 states and D.C. Every year on June 1st, PJM begins a new "delivery year." This is the date when the "Capacity Tags" (or PLC) assigned to every commercial building are updated based on the previous summer’s usage. Why does this matter to you? Because the capacity charge often makes up 25% to 40% of a commercial electricity bill. If your building was inefficient during the hottest days of last summer, you are about to pay the price for it starting this June. Conversely, what you do this summer will dictate your fixed costs for June 2027 through May 2028.  The Hidden Problem: Understanding Capacity Charges and Your PLC Most business owners look at their bill and see "Kilowatt-hours (kWh)": that’s how much energy you used. But the Capacity Charge is based on your "Peak Load Contribution." Think of it like a "reservation fee" for the grid. PJM needs to ensure there is enough power available if every single building turned on every single light and AC unit at the exact same moment. To fund this readiness, they charge businesses based on their highest usage during the grid's "Five Peak Hours" of the previous summer. The Problem: If your restaurant, condo building, or school had a massive spike in usage on a Tuesday afternoon in July when the grid was stressed, your PLC (or Capacity Tag) will be high. You will then be billed at that "peak" rate every single month for the following year, regardless of how little energy you use in the winter. For many commercial clients, this is a "ghost charge" that feels impossible to control. But with the right services , it becomes a manageable variable.