
Despite What You Might Read
Use of Coal Declines
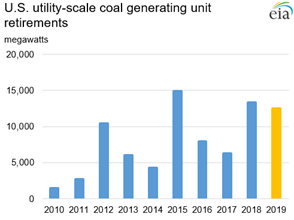
Source: U.S. Energy Information Administration, Form EIA-860, Annual Electric Generator Report and Form EIA-860M, Monthly Update to the Annual Electric Generator Report.
Notes: Data for 2010 through 2018 are final; data for 2019 are preliminary. Megawatts represent summer capacity of generating units.
Coal retirements in 2019 were not limited to any one state or type of coal. The three largest coal plants to retire in 2019 were First Energy Bruce Mansfield (2,490 MW) in Pennsylvania, Navajo (2,250 MW) in Arizona, and Gorgas (1,063 MW) in Alabama. On a state-wide basis, the states with the largest coal capacity retirements were:
1. Pennsylvania (2,589 MW, or 20% of total coal retirements)
2. Arizona (2,250 MW, or 18%)
3. Illinois (2,002 MW, or 16%)
4. Alabama (1,063 MW, or 8%)
5. Georgia (982 MW, or 8%)
Broken down by primary coal rank, bituminous coal (9,276 MW) saw the largest drop in capacity, followed by subbituminous coal (3,166 MW).
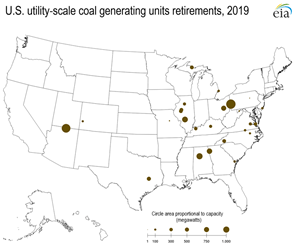
Source: U.S. Energy Information Administration, Form EIA-860, Annual Electric Generator Report and Form EIA-860M, Monthly Update to the Annual Electric Generator Report.
Note: Data for 2019 are preliminary.
The increase in coal-unit retirements since 2010 has significantly reduced coal-unit capacity. During the past decade, U.S. total coal summer capacity dropped from 314,555 MW in 2010 to 226,786 MW in 2019, a 28% reduction in summer capacity. Annually, coal-unit capacity has declined by an average of 3.5%. About 89% of the change in coal-unit capacity between 2010 and 2019 (87,769 MW) can be attributed to coal-unit retirements (78,447 MW) occurring in 2011 through 2019. The remaining 11% reduction (9,322 MW) is from the net effect of the fuel switching of coal units to other fuels (primarily natural gas) (an 18,458 MW reduction). It is also a result of capacity additions from new coal units coming online (mostly in 2011 and 2012) (a 9,136 MW addition). The 2019 5.5% year-over-year decrease in coal capacity (239,962 MW to 226,783 MW) is, on a percentage basis, the third-largest this decade. The largest year-over-year declines of the decade were in 2015 at 6.2% and in 2018 at 6.0%.
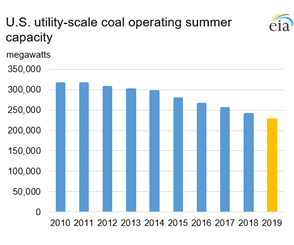
Source: U.S. Energy Information Administration, Form EIA-860, Annual Electric Generator Report and Form EIA-860M, Monthly Update to the Annual Electric Generator Report.
Note: Data for 2010 through 2018 are final; data for 2019 are preliminary. Megawatts represent summer capacity of generating units.
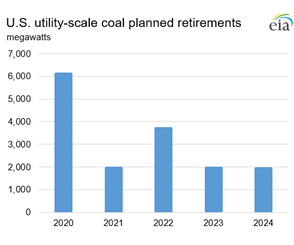
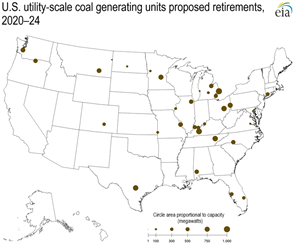
According to the U.S. Energy Information Administration’s (EIA) latest inventory of electric generators, retirements of coal units are expected to continue into the 2020s. In the first half of the decade (2020–2024), 15,663 MW of coal capacity has reported plans to retire. Currently, 2020 has the highest total of planned retirements (6,102 MW), followed by 2022 (3,713 MW). Planned retirements are expected in all parts of the country. The states with the largest planned retirements are Michigan (2,606 MW), Ohio (1,500 MW), Kentucky (1,371 MW), North Carolina (960 MW) and Tennessee (870 MW). The plants with the largest planned capacity retirements are St. Clair in Michigan (1,065 MW in May 2022), Paradise in Kentucky (971 MW in January 2020), and Bull Run in Tennessee (870 MW in December 2023). Broken down by primary coal rank, subbituminous coal has the most planned retirements with 8,274 MW, followed by bituminous coal (7,122 MW), lignite (157 MW) and waste coal (110 MW).
Source: U.S. Energy Information Administration, Form EIA-860, Annual Electric Generator Report and Form EIA-860M, Monthly Update to the Annual Electric Generator Report.
Note: All data are preliminary. Megawatts represent summer capacity of generating units.
Source: U.S. Energy Information Administration, Form EIA-860, Annual Electric Generator Report and Form EIA-860M, Monthly Update to the Annual Electric Generator Report.
Note: All data are preliminary.
Principal Contributor: Alex Gorski (Alexander.Gorski@eia.gov)