Green Electricity & Your Home, Part II
February 23, 2010

In Part I of this series, I introduced you to the idea of purchasing "green" power for your home. If you need to catch up, click on the Part I link at the start of this paragraph. Then come back here. I'll wait.
Back? Good.
This particular article will focus on how you can save with our CleanSteps℠ Windpower program (provided by Washington Gas Energy Services), and a word of caution.
Pricing
As I said in Part I, local wind pricing is more expensive than our standard electricity offering. That being said, a lot of our pricing either comes close to or beats what you're paying your local utility right now for non-renewable energy. That's a good thing.
We have two packages: 50% local wind, and 100% local wind. Here's our pricing details, as of the publication date of this blog posting:
Pepco (DC)
1 year @ 50%=11.20¢ (versus the current Price to Compare of 11.34¢)
2 years @ 50%=11.10¢ (versus the current Price to Compare of 11.34¢)
1 year @ 100%=12.40¢ (versus the current Price to Compare of 11.34¢)
2 years @ 100%=12.30¢ (versus the current Price to Compare of 11.34¢)
Pepco (MD)
1 year @ 50%=11.50¢ (versus the current Price to Compare of 12.51¢)
2 years @ 50%=11.40¢ (versus the current Price to Compare of 12.51¢)
1 year @ 100%=12.70¢ (versus the current Price to Compare of 12.51¢)
2 years @100%=12.60¢ (versus the current Price to Compare of 12.51¢)
BGE
1 year @ 50%= 11.20¢ (versus the current Price to Compare of 11.97¢)
2 years @50%=11.10¢ (versus the current Price to Compare of 11.97¢)
1 year @ 100%=12.40¢ (versus the current Price to Compare of 11.97¢)
2 years @ 100%=12.30¢ (versus the current Price to Compare of 11.97¢)
Allegheny Power
1 year @ 50%=9.20¢ (versus the current Price to Compare of 8.541¢)
2 years @ 50%=9.10¢ (versus the current Price to Compare of 8.541¢)
1 year @ 100%=10.40¢ (versus the current Price to Compare of 8.541¢)
2 years @ 100%=10.30¢ (versus the current Price to Compare of 8.541¢)
Delmarva Power (MD)
1 year @ 50%=10.70¢ (versus the current Price to Compare of 11.76¢)
2 years 50%=10.70¢ (versus the current Price to Compare of 11.76¢)
1 year @ 100%=11.90¢ (versus the current Price to Compare of 11.76¢)
2 years @ 100%=11.90¢(versus the current Price to Compare of 11.76¢)
Delmarva Power (DE)
1 year @ 50%=11.60¢ (versus the current Price to Compare of 11.76¢)
2 years @ 50%=11.50¢ (versus the current Price to Compare of 11.76¢)
1 year @ 100%=12.80¢ (versus the current Price to Compare of 11.76¢)
2 years @ 100%=12.70¢ (versus the current Price to Compare of 11.76¢)
Price to Compare is the average cost per kilowatt-hour for generation and transmission service, based on your rate classification. The Price to Compare is a tool for you to use in comparing your utility's rates with offers from competing electricity suppliers -- like us. This pricing can change.
When you sign up for CleanSteps℠ Windpower, you get the same features as all of our energy packages:
- A fixed price for the length/term of the contract (1 year or 2 years)
- Painless switchover of suppliers (it's all an accounting change, basically)
- The convenience (relatively speaking) of dealing with your local utility for outages, billing, etc.
Caution
There is one caveat, though, when it comes to buying green energy. Other companies in this area are offering wind power. Many of them, though, are selling what's called "national wind power." This means their power comes from other parts of the country. By purchasing national wind power, you aren't doing anything to improve the ecosystem here in the mid-Atlantic.
Unfortunately, local wind is a bit more expensive than national wind. But given the tradeoff, I think ourCleanSteps℠ Windpower offering comes out ahead, because you're helping the environment right here in the mid-Atlantic.
By now, I hope you're convinced to take the green plunge and purchase your green energy through the marketing relationship we have with Electric Advisors, Inc. and Washington Gas Energy Services (WGES). To start the process, click here. You'll need about 10 minutes and copies of your electric and natural-gas bills. Use this link for our Preferred Pricing, too. You'll get prices that are better than what WGES offers in its own marketing efforts.
CleanSteps℠ Windpower is a service mark of Washington Gas Energy Services.

In the world of commercial operations, finding a way to slash overhead by double digits without spending a dime upfront is usually a red flag for a "too good to be true" offer. But in 2026, for businesses operating within the BGE, Pepco, Potomac Edison, and Delmarva utility territories across Maryland and Delaware, this isn't a sales pitch, it’s a regulatory reality. Community solar has evolved from a niche pilot program into a mainstream financial strategy for savvy business owners. If your business pays its own utility bills but doesn't have the roof space, the capital, or the long-term lease to install traditional solar panels, community solar is your bridge to immediate savings. The good news? You can typically reduce your monthly electricity spend by 8% to 12% simply by enrolling. Here is how your business can capture this "easy win." Key Takeaways Zero Upfront Costs: No installation, no equipment maintenance, and no capital expenditure. Guaranteed Savings: Most subscriptions offer a fixed percentage discount (typically 8–12%) on the solar credits applied to your bill. Tenant-Friendly: Perfect for businesses that rent their office, warehouse, or retail space. Market Reach: Available to businesses in BGE, Pepco, Potomac Edison, and Delmarva (MD & DE) territories. Risk Mitigation: Electric Advisors handles the vetting to ensure you choose a project with favorable terms and no hidden cancellation fees.

For most business owners in Washington, D.C. and Maryland, June 1st marks the unofficial start of summer: the return of rooftop happy hours, tourists swarming the National Mall, and the inevitable cranking of the HVAC system. But in the world of energy management, June 1st is something much more significant. It is the "Energy New Year." If you manage a commercial property, a non-profit, or a restaurant, this date represents the reset button for how your utility costs are calculated for the next twelve months. While many decision-makers focus solely on the "supply rate" on their bill, there is a hidden mechanism called the Peak Load Contribution (PLC) that could be quietly inflating your costs by thousands of dollars The good news? You aren’t powerless. By understanding how the grid works and taking a few strategic steps this spring, you can "beat the surge" and secure better financial predictability for your organization. The June 1st Milestone: Why It’s the "Energy New Year" In the Mid-Atlantic region: specifically within the territories served by utilities like Pepco and BGE: we operate under the PJM Interconnection . PJM is the regional transmission organization that coordinates the movement of wholesale electricity across 13 states and D.C. Every year on June 1st, PJM begins a new "delivery year." This is the date when the "Capacity Tags" (or PLC) assigned to every commercial building are updated based on the previous summer’s usage. Why does this matter to you? Because the capacity charge often makes up 25% to 40% of a commercial electricity bill. If your building was inefficient during the hottest days of last summer, you are about to pay the price for it starting this June. Conversely, what you do this summer will dictate your fixed costs for June 2027 through May 2028. The Hidden Problem: Understanding Capacity Charges and Your PLC Most business owners look at their bill and see "Kilowatt-hours (kWh)": that’s how much energy you used. But the Capacity Charge is based on your "Peak Load Contribution." Think of it like a "reservation fee" for the grid. PJM needs to ensure there is enough power available if every single building turned on every single light and AC unit at the exact same moment. To fund this readiness, they charge businesses based on their highest usage during the grid's "Five Peak Hours" of the previous summer. The Problem: If your restaurant, condo building, or school had a massive spike in usage on a Tuesday afternoon in July when the grid was stressed, your PLC (or Capacity Tag) will be high. You will then be billed at that "peak" rate every single month for the following year, regardless of how little energy you use in the winter. For many commercial clients, this is a "ghost charge" that feels impossible to control. But with the right services , it becomes a manageable variable.
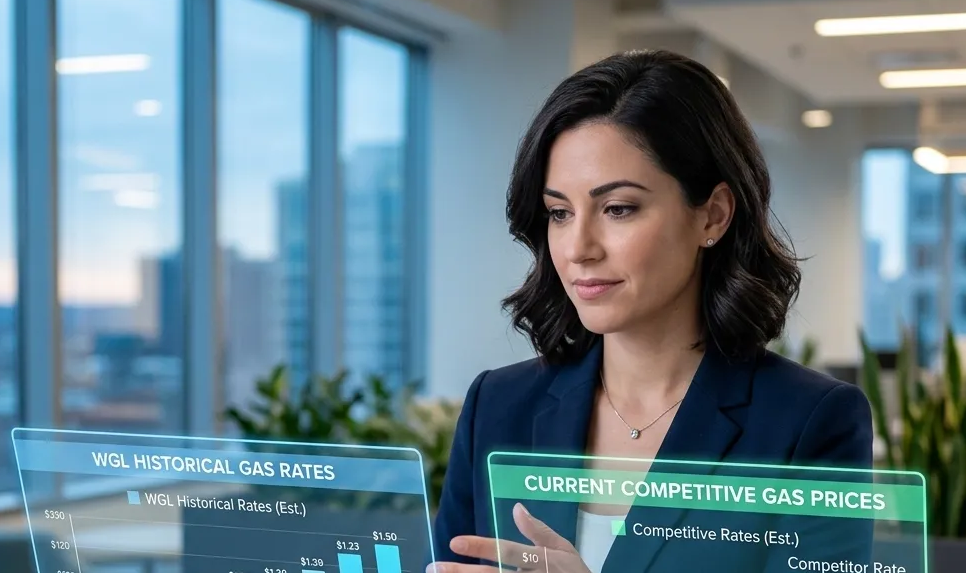
For business owners in Maryland, Washington, DC, and Virginia —right here in our backyard —energy costs are more than just a line item: they are a significant variable that can impact quarterly profitability and long-term operational planning. In recent years, the natural gas market has been characterized by notable volatility. From global supply chain disruptions to shifting domestic production levels, the price you pay for the blue flame in your furnace or the heat in your commercial kitchen has likely felt like a moving target. At Electric Advisors, Inc. , we believe that data-driven decision-making is the only way to effectively manage utility expenses. To help you understand where the market has been and where it is going, we have analyzed the historical procurement costs for Washington Gas (WGL) and compared them to the current opportunities available through competitive suppliers across Maryland, Washington, DC, and Virginia. The results are clear: across the WGL service territory in MD, DC, and VA , the cost of sticking with the utility’s default Purchased Gas Charge (PGC) may be significantly higher than many business owners realize. The Benchmark: Washington Gas Historical PGC Rates in Maryland, DC, and Virginia Every month, Washington Gas updates its Purchased Gas Charge (PGC) . This is the rate at which the utility passes through the cost of the natural gas it buys on the wholesale market to its customers. By law, the utility does not make a profit on the gas itself; they make their money on the delivery and infrastructure. However, the price they pay—and the price you eventually see on your bill—is subject to the fluctuations of the monthly wholesale market. For businesses in the broader WGL footprint, the important takeaway is this: Washington Gas default supply pricing and competitive market opportunities are consistent across its service territory in Maryland, Washington, DC, and Virginia. In other words, the same benchmark applies whether your business is in suburban Maryland, downtown DC, or Northern Virginia. Looking back at the last 24 months across the WGL service territory in MD, DC, and VA , we see a story of dramatic shifts: 24-Month Average WGL PGC: Approximately $0.68 per therm . The 2025 Spike: In April 2025, rates peaked at a staggering $0.8085 per therm . The 2026 Moderation: As of April 2026, the WGL rate has settled to $0.6382 per therm . While the 2026 rate is a welcome decrease from the highs of the previous year, it remains significantly higher than the rates seen a decade ago. For context, in 2010, the rate hovered around $0.32 per therm. We have seen a steady, long-term upward trend that necessitates a more proactive approach to commercial natural gas rates .