
Covid-19 and Electricity Usage
Commercial Usage Takes A Dive
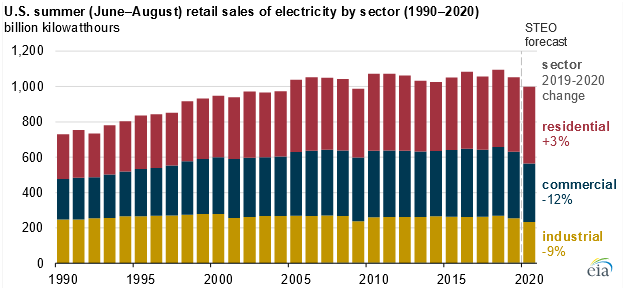
Source: U.S. Energy Information Administration, Short-Term Energy Outlook
The U.S. Energy Information Administration (EIA) expects U.S. electricity demand to total 998 billion kilowatthours this summer (June through August), the lowest level of summer electricity consumption in the United States since 2009 and 5% less than last summer.
EIA expects electricity consumption to be lower this year largely as a result of efforts to reduce the spread of COVID-19. Most of the expected decline in retail electricity sales occurs in the commercial and industrial sectors, which EIA forecasts to be 12% and 9% less, respectively, than during summer 2019. EIA expects residential electricity sales to grow by 3% this summer because more people are working from home and following social distancing practices.
Normally, weather is one of the primary factors in determining electricity demand in the residential and commercial sectors. The National Oceanic and Atmospheric Administration (NOAA) forecasts that U.S. cooling degree days—an indicator of demand for air conditioning—for June, July, and August 2020 will be 1% lower than last summer.
This summer, however, other factors are affecting electricity demand more than temperature. Although state and local governments are relaxing stay-at-home orders, social distancing guidelines will likely result in Americans spending more time at home than usual this summer. In addition, many people that had worked in offices are now working from home, shifting electricity demand from the commercial sector to the residential sector.
Macroeconomic indicators are primary drivers in EIA forecasts for electricity consumption in the commercial and industrial sectors. EIA’s short-term economic assumptions are based on the macroeconomic model from IHS Markit. This model projects non-farm employment will fall by 13% in 2020 and that the electricity-weighted industrial production index will contract by 12% in 2020.
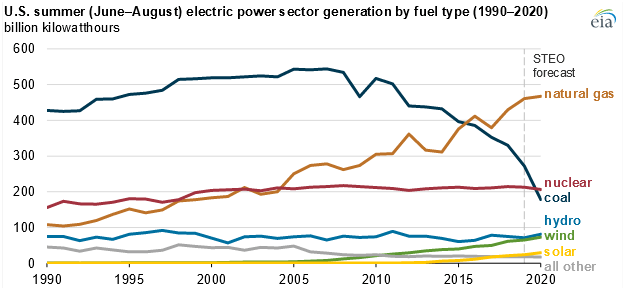
Source: U.S. Energy Information Administration, Short-Term Energy Outlook
The amount of electricity generation from coal will likely be lower than last summer as a result of less electricity demand. EIA forecasts coal-fired power plants will generate 178 billion kilowatthours (kWh) between June and August 2020, down from 272 billion kWh last summer. Coal continues its downward trend in its contribution to U.S. power generation, and EIA expects its generation share will fall from 24% of the electricity generated during summer 2019 to 17% this summer. EIA forecasts the amount of coal generation to be lower than nuclear generation this summer (207 billion kWh).
EIA expects that natural gas-fired power plants will generate 467 billion kWh this summer, slightly higher than natural gas generation last summer (460 billion kWh). Forecast natural gas prices remain low this summer, making it relatively more economical than coal for power generation. EIA forecasts natural gas’s share of electricity generation to increase from 41% last summer to 44% this summer.
EIA also expects the renewable energy share of electricity generation this summer will increase compared with last summer.
Significant additions of new wind and solar generating capacity, especially in the Midwest region and Texas, drive EIA’s forecast that U.S. wind’s share of electricity generation will grow to 7% this summer and utility-scale solar will grow to 3%.
EIA has published a supplement to the Short-Term Energy Outlook that provides more details about the summer 2020 electricity industry outlook.
Principal contributor: Tyler Hodge
Tags: consumption/demand, electricity, STEO (Short-Term Energy Outlook)